nf-core/genomeqc
Compare the quality of multiple genomes, along with their annotations.
Introduction
This document describes the output produced by the nf-core/genomeqc.
The directories listed below will be created in the results directory after the pipeline has finished. All paths are relative to the top-level results directory.
Pipeline overview
The pipeline is built using Nextflow and processes data using the following steps:
- NCBI genome download - Download genomes and their annotations from RefSeq and GenBank.
- Genome quality metrics:
- Annotation quality metrics:
- AGAT sp_statistics - Gene statistics.
- AGAT sp_keep_longest_isoform - Filter longest isoform from GXF file.
- Gene overlaps - Find overlapping genes (sense and antisense).
- Decontamination:
- FCS-GX - Foreign genome contamination screening.
- FCS-adaptor - Adaptor and vector contamination screening.
- FCS-GX clean genome - Removal of contamination from assembly.
- Tiara - Sequence classification (domain and organelle level).
- GffRead - Extract longest isoform from FASTA file.
- BUSCO - Genome completeness based on single copy markers.
- TE annotation (optional) - Transposable element identification and masking.
- Orthofinder - Phylogenetic orthology inference.
- Tree summary - Phylogenetic summary plot.
- Shiny app - Dynamic tree summary plot adjuster.
- MultiQC - Aggregate report describing results and QC from the whole pipeline.
- Pipeline information - Report metrics generated during the workflow execution.
Decontamination
FCS-GX
FCS-GX is a module in NCBI’s FCS (Foreign Contamination Screening) toolkit designed to detect contaminant sequences of foreign organisms from genome assemblies.
It generates a report with assembly sequence classifications, contamination summaries, and cleaning recommendations.
Output files
decontamination/fcs-gx<assembly>_<taxid>.fsc_gx_report.txt: Summary report with sequence classification and cleaning recommendations.<assembly>_<taxid>.taxonomy.rpt: Detailed breakdown of sequence classification.
FCS-Adaptor
FCS-Adaptor is part of the NCBI’s FCS toolkit. It’s specifically designed to detect adaptor and vector contamination that sometimes remain in genome assemblies.
It generates a report with a list of sequences flagged as adaptor or vector matches, cleaning recommendations, and the cleaned genome assembly.
Output files
decontamination/fcs-adaptor<assembly>.cleaned_sequences.fa.gz: Genome assembly with contaminant regions removed.<assembly>.fsc_adaptor_report.txt: Summary report with flagged sequences and cleaning recommendations.
We recommend ignoring the cleaned genome assembly output by this module, as the vector and adapter removal is done by the FCS-GX clean genome module (see below).
FCS-GX clean genome
FCS-GX clean genome is based on a command of the NCBI’s FCS toolkit which applies the recommended cleaning actions to the genome assembly based on the screening results.
It outputs a cleaned version of the genome assembly based on the recommended actions from FCS-GX and FCS-Adaptor, with the contaminant sequences removed and sequences with local contaminants trimmed.
Output files
decontamination/cleaned_genome<assembly>.cleaned.fasta: Genome assembly with contaminant sequences removed and contaminant regions trimmed.<assembly>.contaminants.fasta: Sequences classified as contaminants.
Tiara
Tiara is a deep learning–based classifier designed to identify eukaryotic, archaeal, and bacterial sequences, as well as organelle genomes.
It outputs a report with each sequence of the genome assembly labelled as Eukarya, Archea, Bacteria, organelle or unknown.
Output files
decontamination/tiara/raw/<assembly>.txt: Sequence classifications for the original (raw) assembly.log_<assembly>.txt: Log file with classification statistics and model information.
decontamination/tiara/cleaned/<assembly>.txt: Sequence classifications for the FCS-GX cleaned assembly.log_<assembly>.txt: Log file with classification statistics and model information.
NCBI genome download
NCBI genome download is a tool for downloading assemblies from the NCBI FTP site.
It inputs RefSeq or GeneBank assembly accessions and downloads the respective assembly (RefSeq and GeneBank) and annotation (RefSeq only) in FASTA and GFF formats. If local files are provided, this step is skipped.
Output files
ncbigenomedownload/<assembly>.fa.gz: Genome assembly in FASTA format (GeneBank and RefSeq outputs).<assembly>.gff3.gz: Annotation in GFF format (RefSeq output).
This directory will only be present if --save_assembly flag is set.
Quast
Quast provides different quality metrics about the genome assembly. It computes contiguity stats (N50, N90), genome size, GC% content and number of sequences.
It generates a report in different formats, as well as an HTML file with in integrated contig viewer.
Output files
quast/<species_name>/icarus.html: Contig viewer in HTML formatreport.html: Assembly stats in HTML formatreport.pdf: Assembly stats in PDF formatreport.tsv: Assembly statistics in TSV format
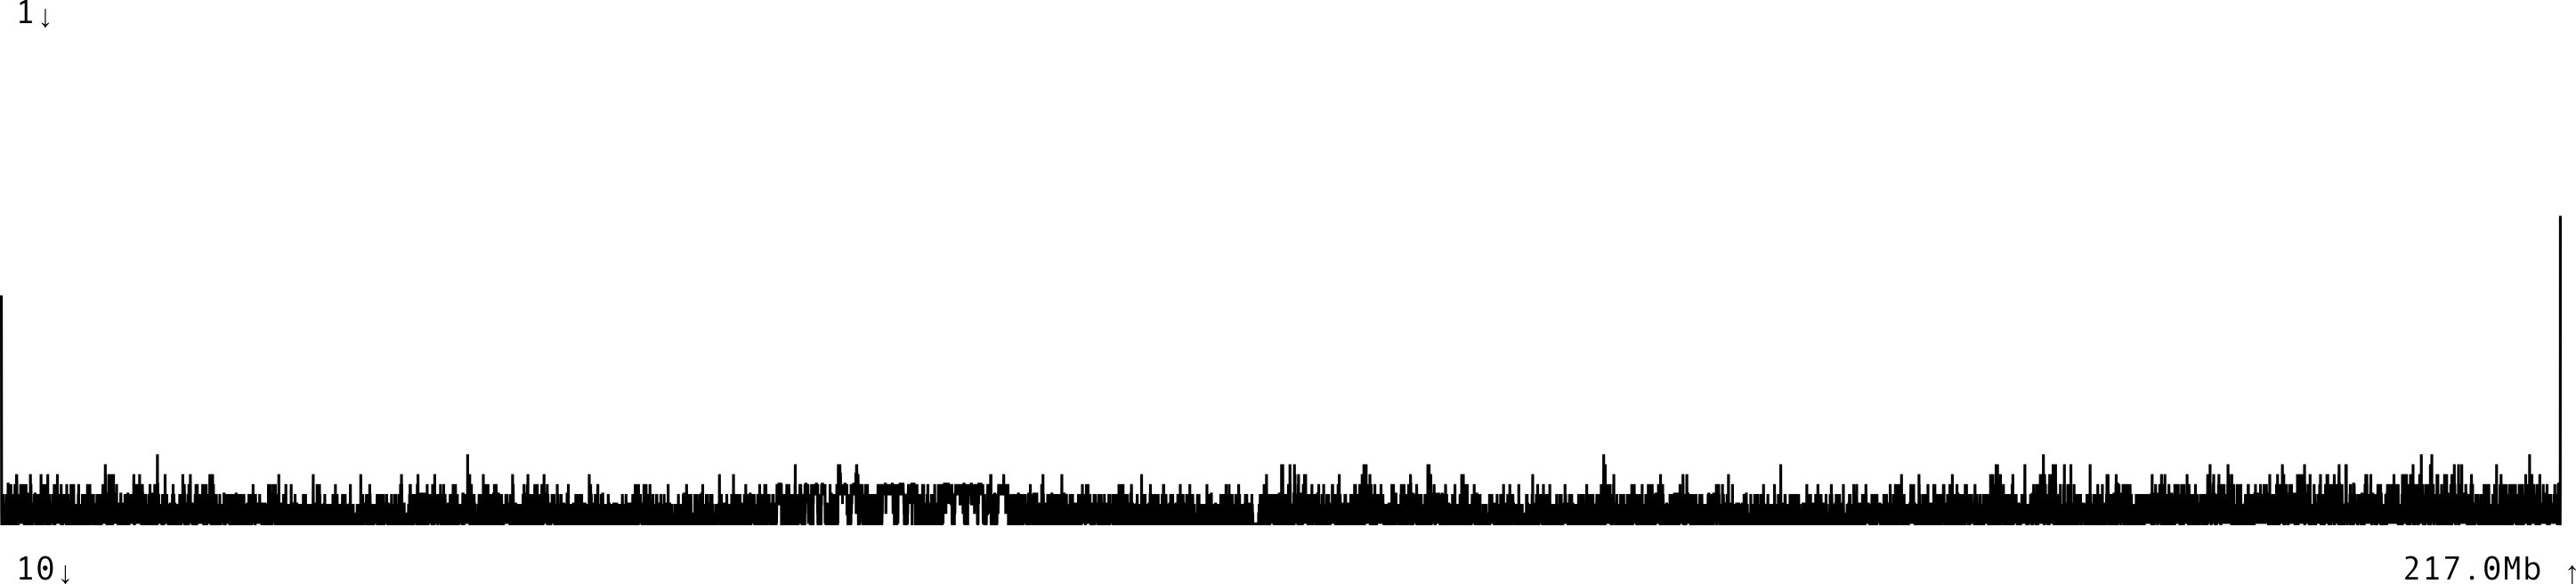
tidk
tidk is a tool to identify and visualise telomeric repeats from asseblies.
It will use a known telomeric repeat as input string, and will find occurrences of these sequence in windows across the genome.
Output files
tidk/<species_name>/explore/<species_name>.tidk.explore.tsv: k-mer frequency table used to identify the candidate telomeric repeat.
tidk/<species_name>/search/aposteriori/<species_name>.tsv: Repeat counts per window across the genome (a posteriori repeat identified bytidk explore).<species_name>.bedgraph: Same data in bedgraph format.
tidk/<species_name>/search/apriori/<repeat>/(only when--repeatis provided)<species_name>.tsv: Repeat counts per window for the supplied a priori repeat string.<species_name>.bedgraph: Same data in bedgraph format.
tidk/<species_name>/plot/aposteriori/<species_name>.svg: Plot of the a posteriori telomeric repeat distribution across the genome.
tidk/<species_name>/plot/apriori/<repeat>/(only when--repeatis provided)<species_name>.svg: Plot of the a priori telomeric repeat distribution across the genome.
To run nf-core/genomeqc with tidk, the flag --run_tidk must be provided.
Merqury
Merqury uses k-mers from sequencing reads to evaluate the assembly quality and completness without the need of a high quality reference.
It generates a histogram relating k-mer counts in the read set to their associated counts in the assembly, as well as a completness report.
Output files
merqury/<species_name>/<assembly>.completeness.stats: Assembly completeness statistics.<assembly>.qv: Assembly quality value (QV) score.<assembly>.*.qv: Per-scaffold quality value scores.<assembly>.spectra-cn.ln.png: Linear-scale copy-number spectrum plot.<assembly>.spectra-asm.ln.png: Linear-scale assembly spectrum plot.<assembly>.spectra-cn.fl.png: Full copy-number spectrum plot (optional).<assembly>.spectra-asm.fl.png: Full assembly spectrum plot (optional).<assembly>.hapmers.blob.png: Haplotype-specific k-mer blob plot (optional).
To run nf-core/genomeqc with merqury, the flag --run_merqury must be provided.
AGAT sp_statistics
AGAT sp_statistics computes several annotation metrics such as number of genes, transcripts, exons, etc.
Output files
agat/<species_name>/stats/<species_name>.stats.txt: Gene annotation statistics report.
AGAT sp_keep_longest_isoform
AGAT sp_keep_longest_isoform filters GXF file to keep the longest isoform per gene. Longest isoforms are recommended as input for both BUSCO and Orthofinder.
Output files
agat/<species_name>/longest_isoform/<species_name>.longest.g*f: GXF file with the longest isoform per gene.
This directory will only be present if --save_longest_isoform flag is set.
Gene overlaps
Gene overlaps is a local module based on the R package GenomicRanges, used for manipulating genomic intervals. It finds the number of genes that are overlapping in the GXF file, which can be used as a metric to evaluate the quality of the annotation.
It outputs a brief report with information about the number of reads, the number of genes fully contained in sense direction and in the antisense direction, and the total number of overlapping genes.
Output files
gene_overlaps/<species_name>.counts.tsv: Summary counts of sense and antisense overlapping genes.
GffRead
GffRead extracts the protein sequences using the genome assembly and annoation as input.
Output files
gffread/<species_name>.longest.fasta: Report in tsv format
This directory will only be present if --save_extracted_seqs flag is set.
BUSCO
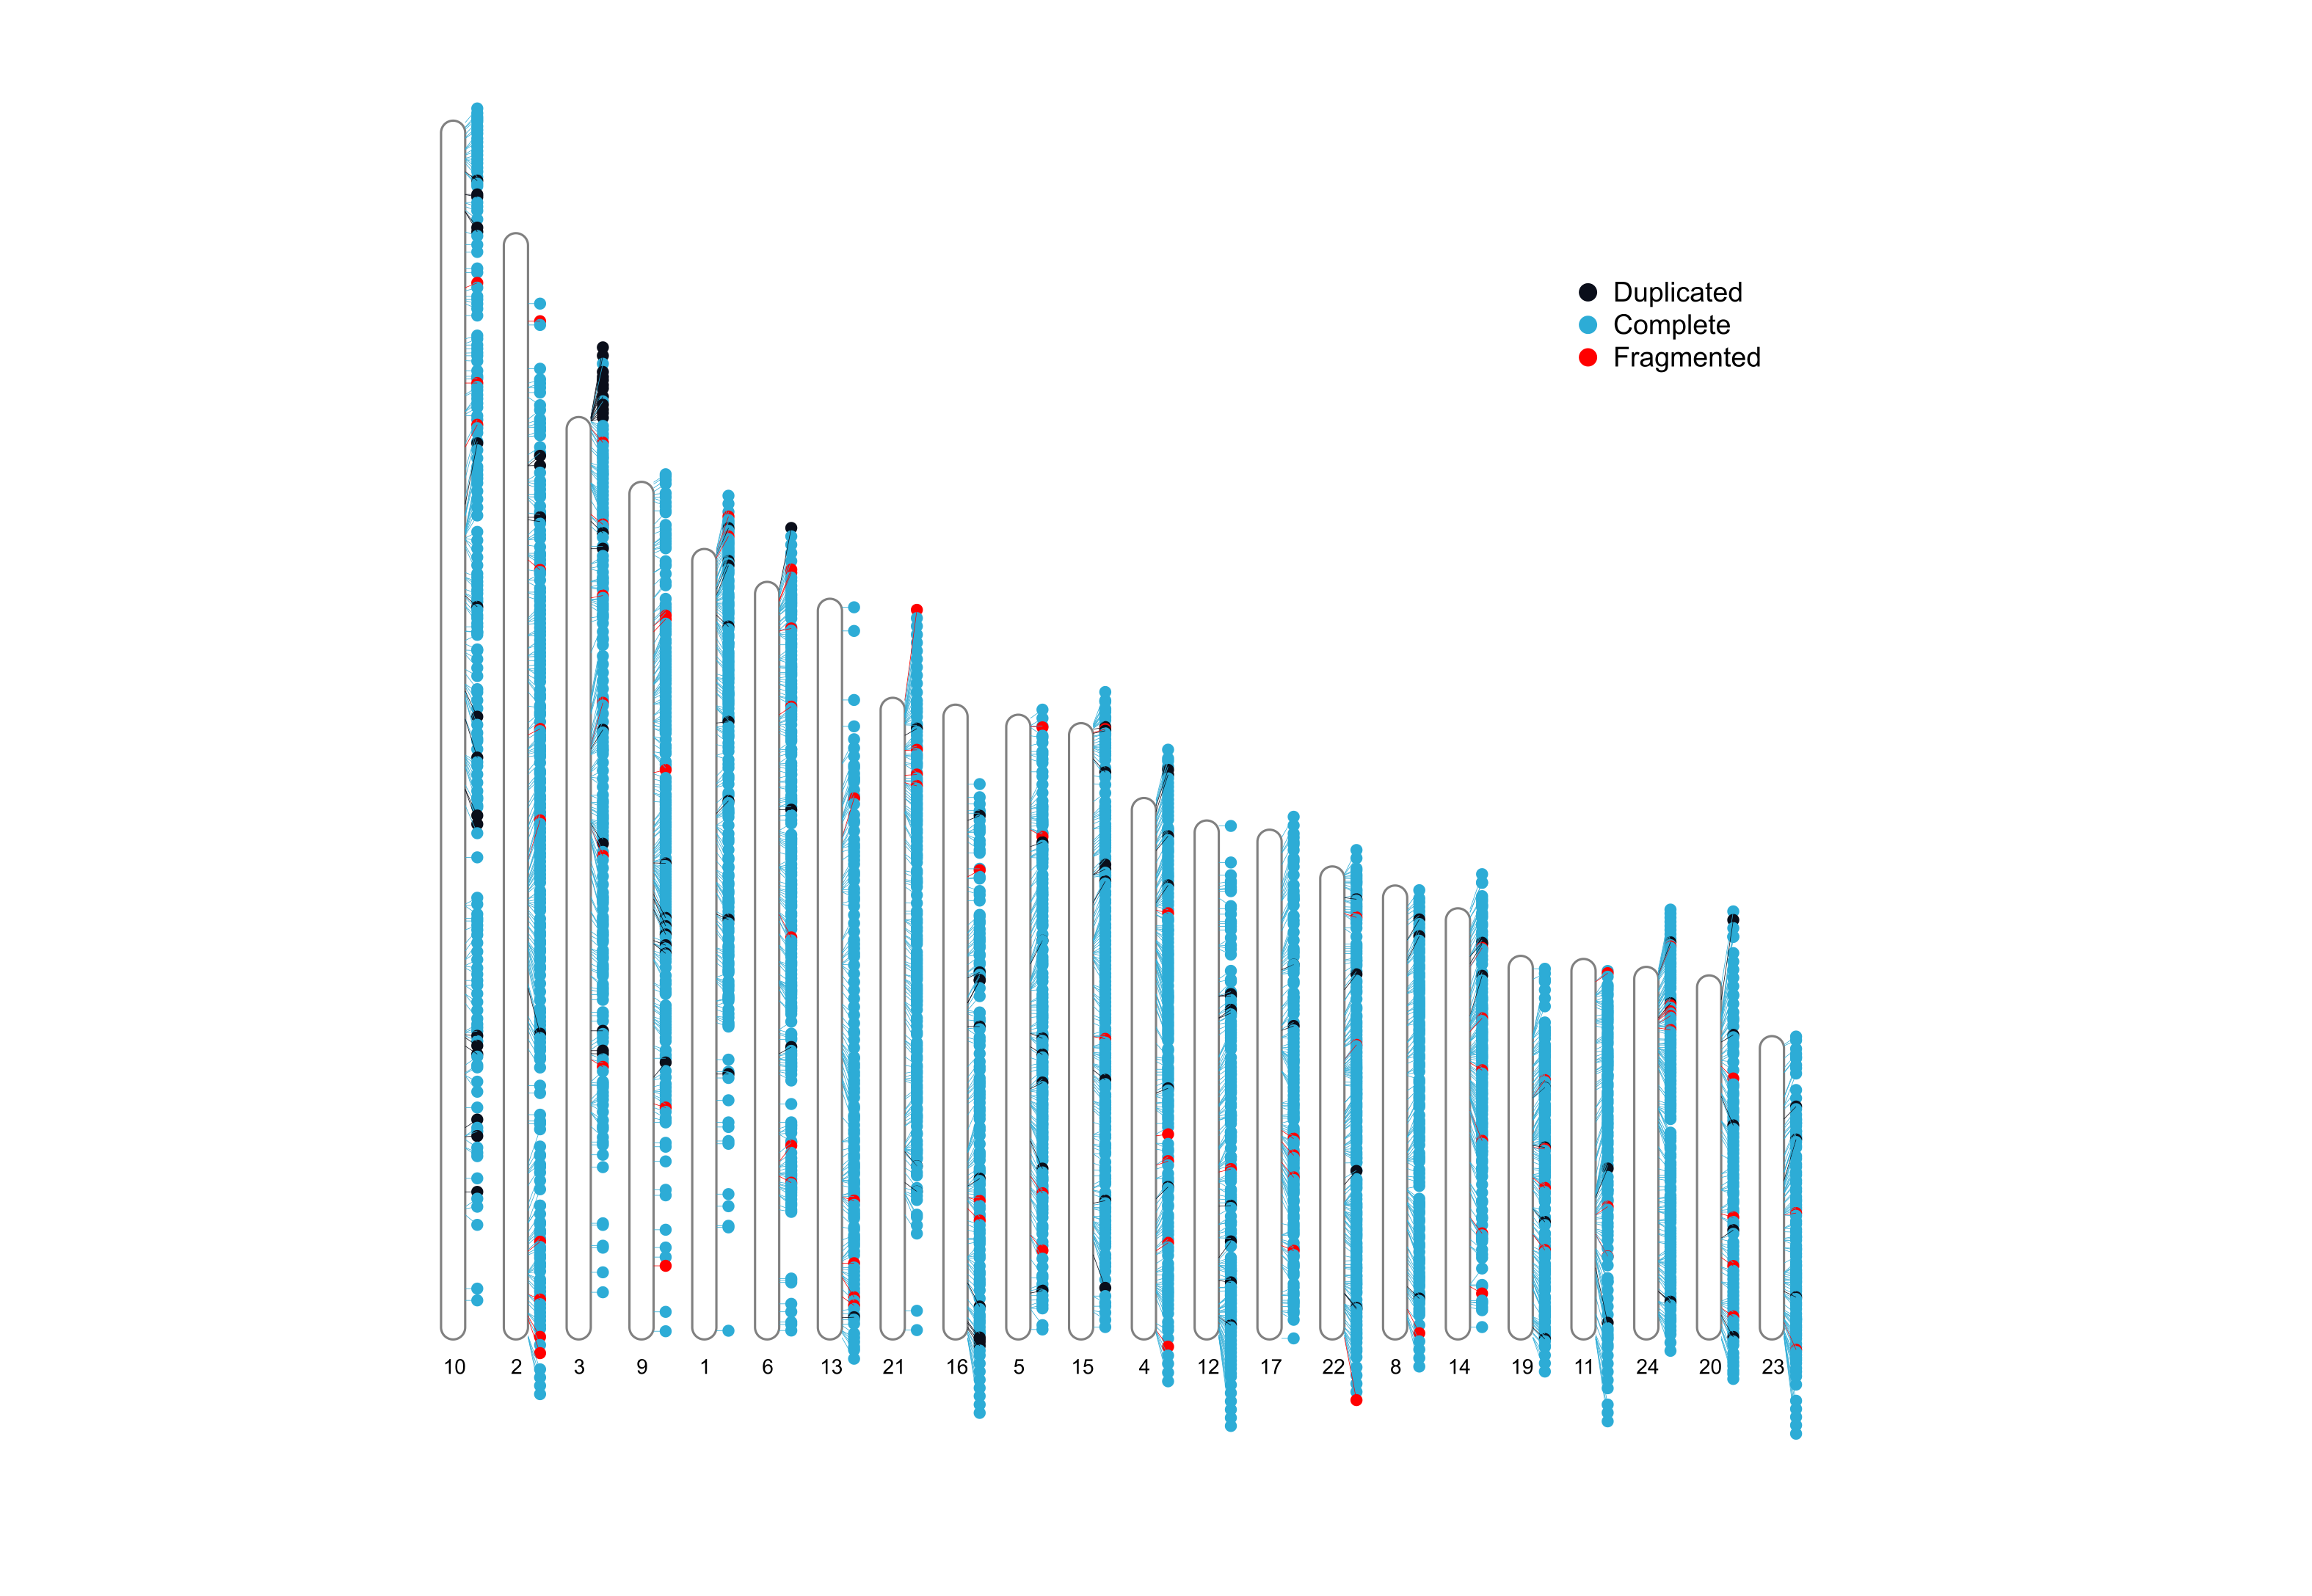
BUSCO is a tool for assessing the quality of assemblies based on the presence of single copy orthotologues. It computes the compleness based on evolutionarily informed expectations of gene content, whether this single copy markers are present in single copy, duplicated, fragmented or absent.
It outputs a report with completness stats, a summarized table with these stats, and an ideaogram with single copy markers mapped against each chromosome or sequence.
Output files
busco/<species_name>/stats/short_summary.specific.<busco_db>.<species_name>.txt: Per-run BUSCO completeness report.<species_name>-<busco_db>-busco.batch_summary.txt: Summarised completeness report.
busco/<species_name>/ideogram/<species_name>_<lineage>.png: Ideogram with the chromosomal location of single-copy markers.
TE annotation
TE annotation is optional and is enabled with --te hite or --te repeatmasker. See usage documentation for full details.
HiTE
HiTE is a fast, alignment-free tool for TE identification and masking. It is the recommended option for quick runs or plant genomes (--is_plant true).
Output files
hite/<species_name>/<species_name>_hite_results/directory containing all HiTE output files, including the masked genome and identified TE families.
RepeatMasker
The RepeatMasker path masks the genome against the DFAM curated repeat library:
- famdb.py – curated repeat library extracted from DFAM h5 partitions (downloaded automatically unless
--RM_download_db false). - CAT + CD-HIT-EST – deduplicates the library.
- RepeatMasker – soft-masks the genome.
With --run_repeatmodeler, RepeatModeler is also run to build a de novo library from the genome, which is merged with the famdb library before masking. RepeatModeler employs RECON, RepeatScout and LtrHarvest/Ltr_retriever for complementary repeat boundary identification.
RepeatMasker screens DNA sequences for interspersed repeats and low complexity sequences, producing a soft-masked genome and summary statistics.
Output files
repeatmasker/<species_name>/<species_name>.masked– soft-masked genome in FASTA format.<species_name>.out– detailed table of repeat positions and classifications.<species_name>.tbl– summary table of repeat annotation results.<species_name>.gff– repeat annotations in GFF format (if produced).
Orthofinder
Orthofinder finds groups of orthologous genes and uses these orthologous genes for phylogenetic inference. It outputs a rooted species tree which is later used to present the quality stats of the assemblies.
The pipeline supports both OrthoFinder v2 and v3 (selected via --ortho_version ; default is v3). Output structure differs slightly between versions, as v3 introduces phylogenetic hierarchical orthogroup inference in addition to the classic MCL-based orthogroups.
Output files
orthofinder/Orthogroups/- Orthogroup assignments from MCL clustering (present in both v2 and v3).
Species_Tree/- Rooted species tree used for downstream quality stats, and (v3 only) node-labelled tree (
SpeciesTree_rooted_node_labels.txt) used to identify clade IDs.
- Rooted species tree used for downstream quality stats, and (v3 only) node-labelled tree (
Phylogenetic_Hierarchical_Orthogroups/(v3 only)- Orthogroups inferred from gene tree analysis at each phylogenetic level in the species tree. These are more accurate than MCL-based orthogroups alone and are the recommended orthogroup set when running v3.
Comparative_Genomics_Statistics/- Summary statistics on orthogroup assignment, e.g.
Statistics_Overall.tsvandStatistics_PerSpecies.tsv.
- Summary statistics on orthogroup assignment, e.g.
This directory will only be present if --save_orthofinder_results flag is set.
Tree summary
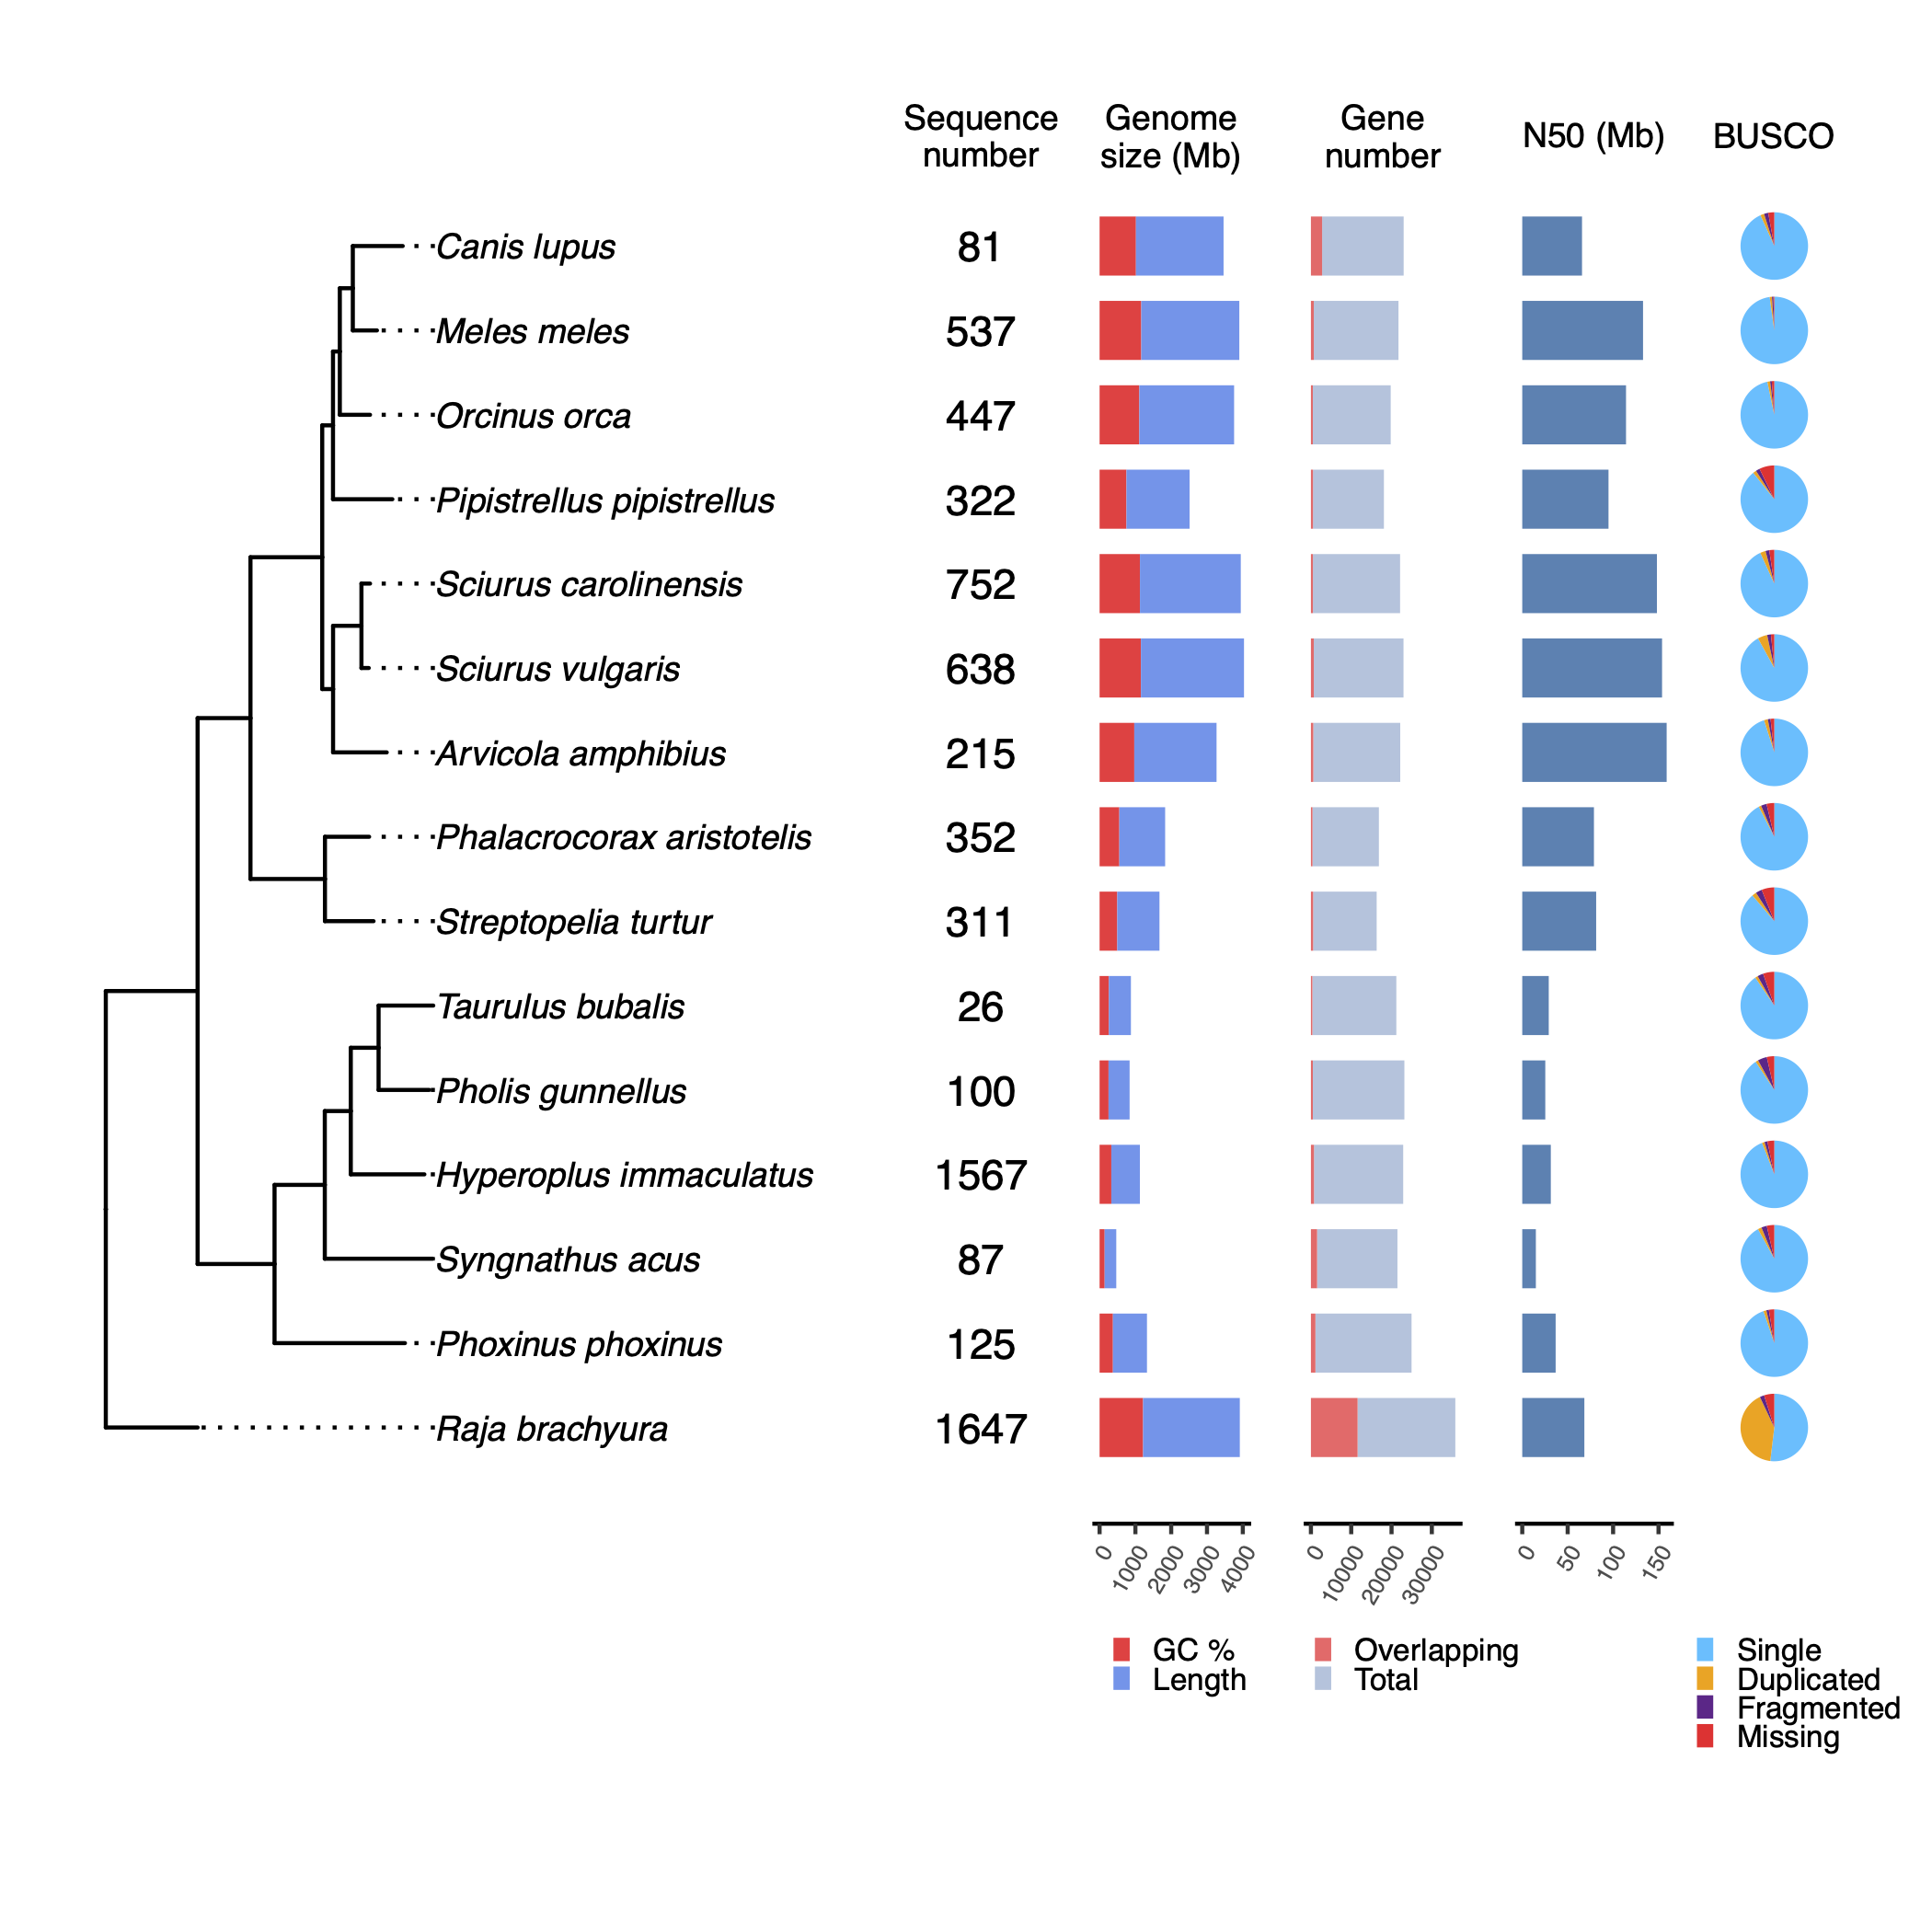
Tree summary is a local module that takes the rooted trees species from Orthofinder, as well as the ouput statistics from the mentioned tools.
The idea of the tree summary is to give some phylogenetic context to the quality stats, which might help users when evaluating the integrity of the assemblies.
Output files
tree/genome_anno/ortree/genome_only/tree_plot.pdf: Tree summary with quality statistics.tree_plot.svg: Same plot in SVG format.
Shiny App
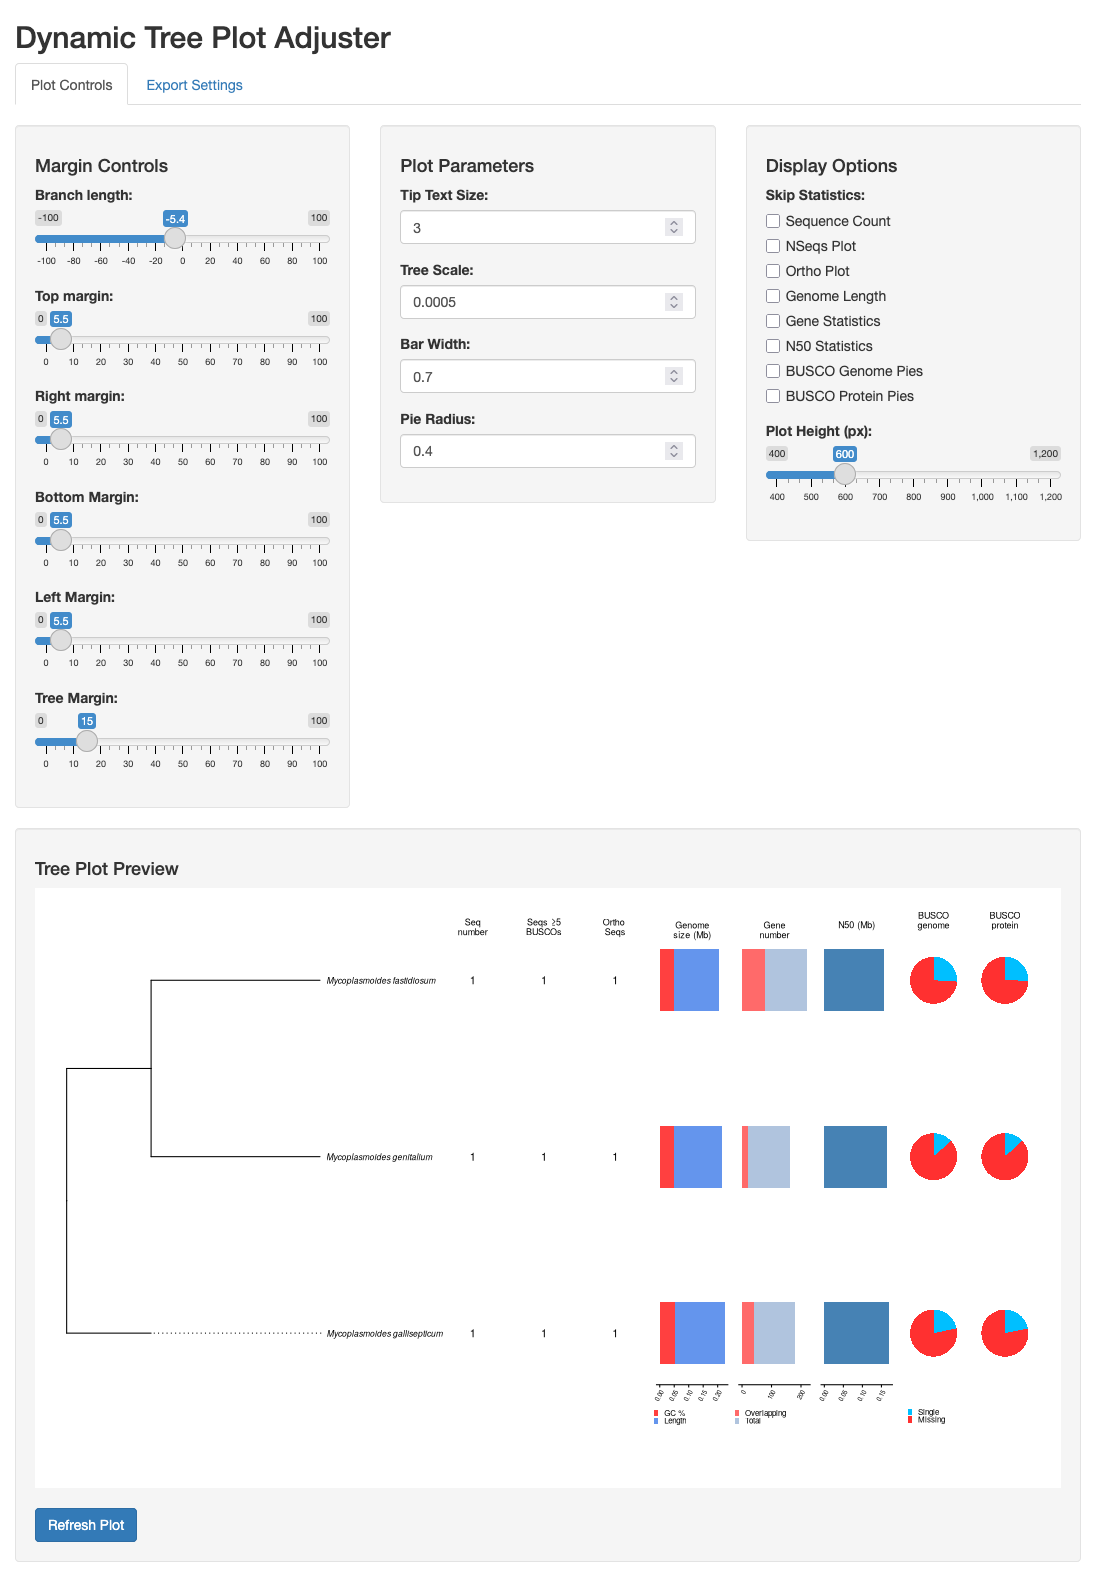
The shiny app module uses Shiny, a package to build interactive web apps from R, to create a dynamic plot adjuster to modify the tree plot in real time. It allows to change plot parameters such as margins, branch length, text size, etc., as well as adding and removing summary statistics next to the tree tips. The modified plot can be saved as a png/svg.
The app has two tabs, the Plot Controls tab to adjust the plot and remove/add features, and an Export Settings tab, that allows to preview the plot to export, change export settings, and save the plot as plot as png/svg.
Output files
shiny/app/shiny_app.sh: excutable to run the shiny app. It can be executed it usingbash shiny_app.sh.shiny_app.R: script containing the code to run the app.tree_functions.R: script containing the code with the functions used by the app.
Reports
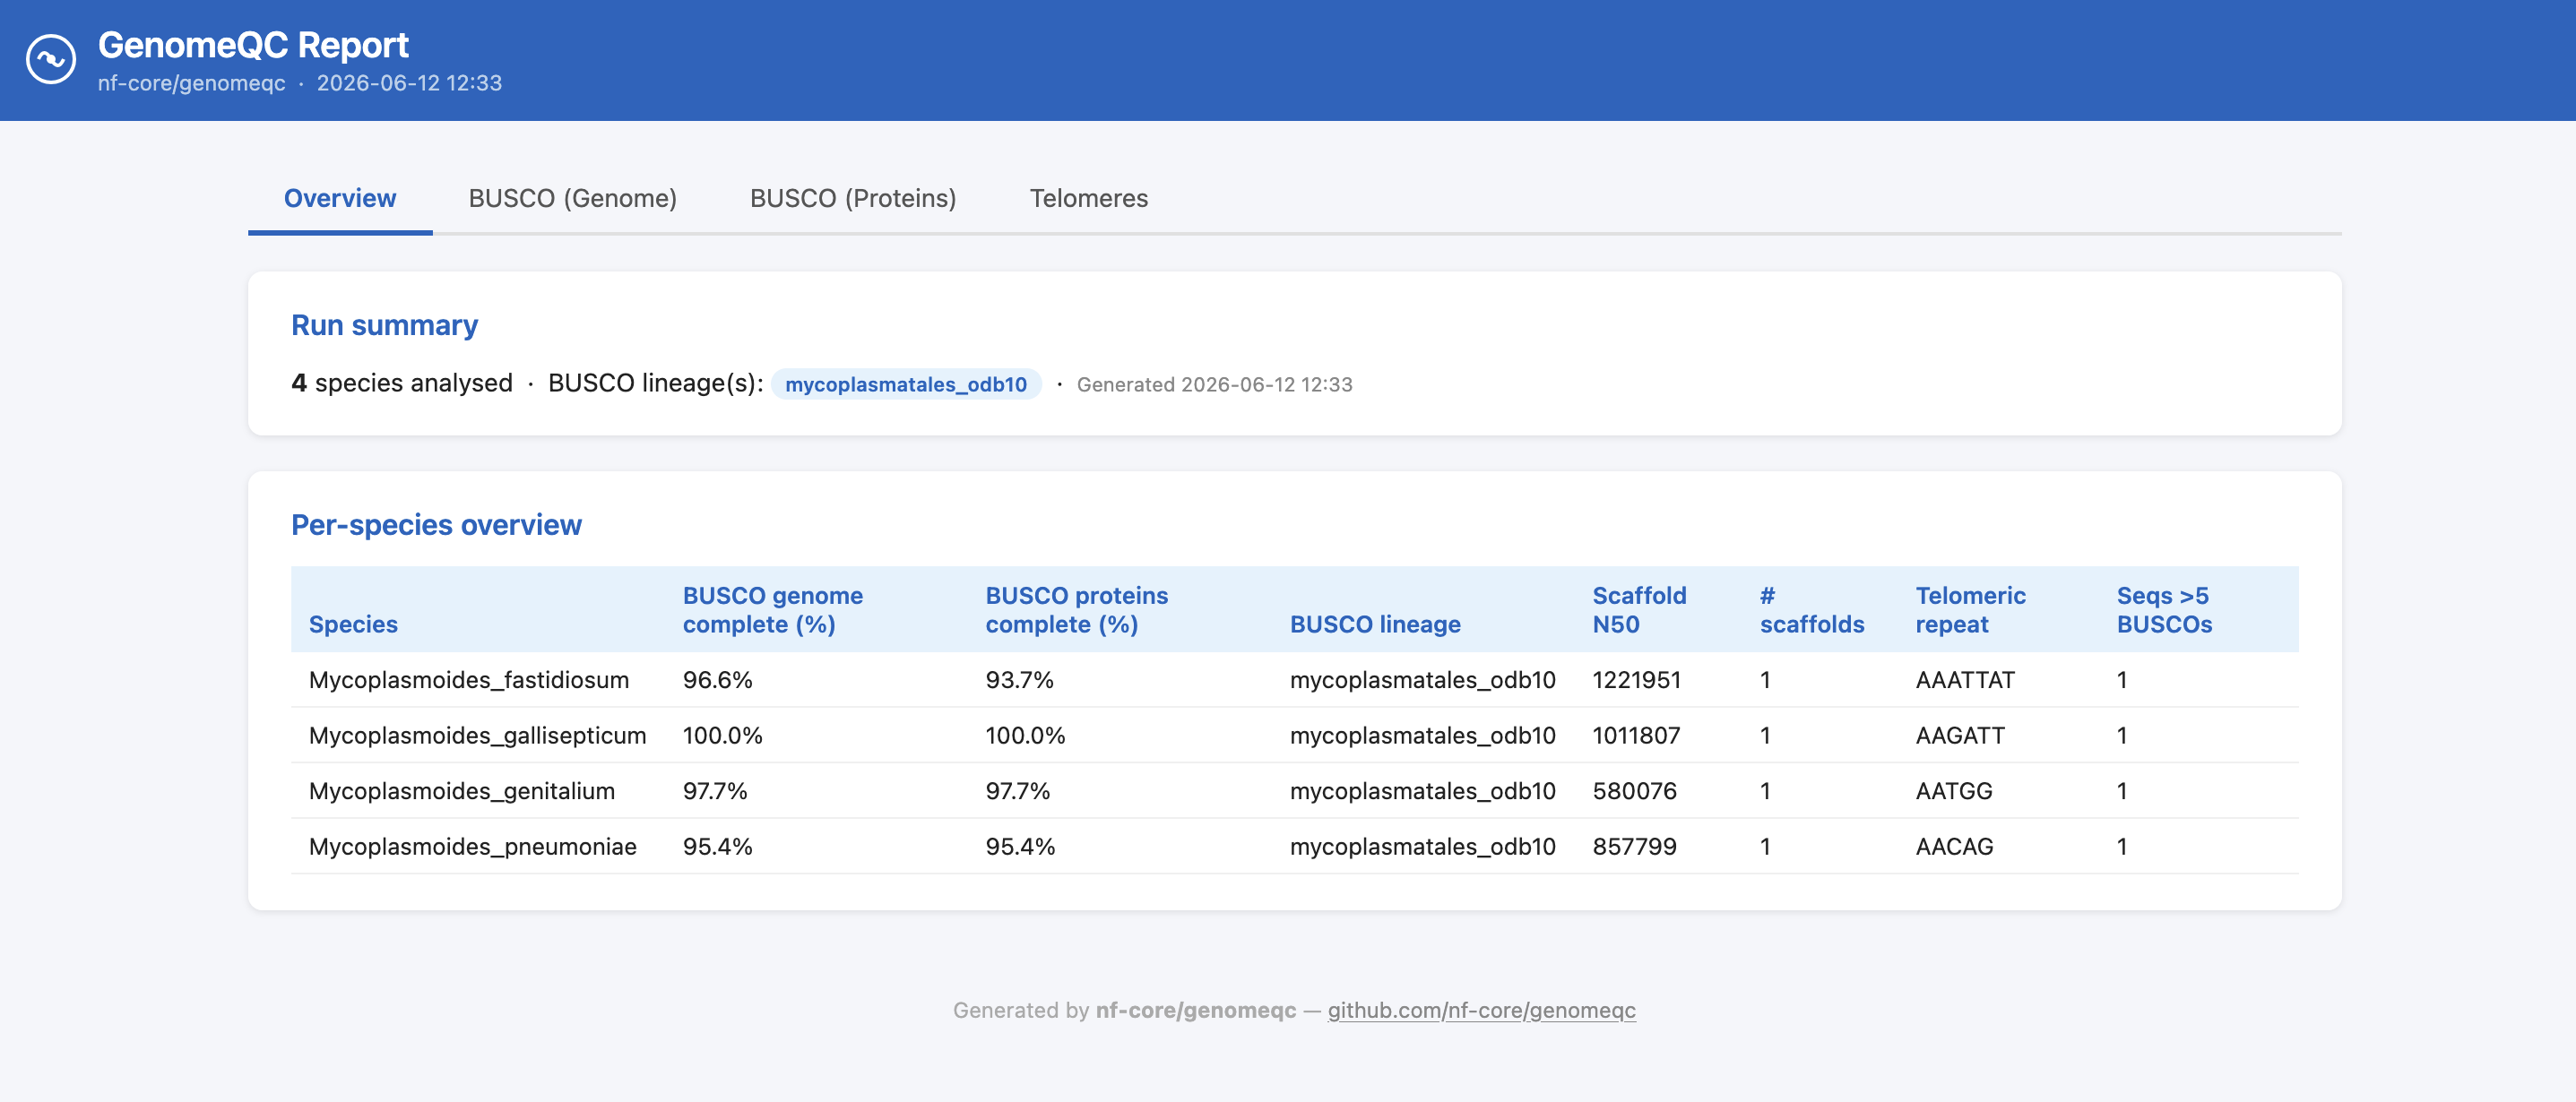
The pipeline summarises the results from the tools above into two reports: a HTML report and an Excel spreadsheet.
The HTML report is a single-file report with one tab per tool. The BUSCO, Telomeres, FCS-GX, FCS-Adaptor and Tiara tabs are only shown if the corresponding tool was run. The Telomeres tab includes a chromosome selector for assemblies with multiple sequences, and a toggle to switch between the a priori and a posteriori tidk searches when both were run.
The Excel report contains the same summary statistics as separate tables.
Agat results are missing from the HTML report, and are not shown in the Excel report. This is yet to be fixed.
Output files
report/html/genomeqc_report.html: Self-contained HTML report summarising the results from all the tools above.
report/excel/genomeqc_tables.xlsx: Excel spreadsheet with the same summary statistics.
MultiQC
MultiQC is a visualization tool that generates a single HTML report summarising all samples in your project. Most of the pipeline QC results are visualised in the report and further statistics are available in the report data directory.
Results generated by MultiQC collate pipeline QC from supported tools e.g. FastQC. The pipeline has special steps which also allow the software versions to be reported in the MultiQC output for future traceability. For more information about how to use MultiQC reports, see http://multiqc.info.
Output files
multiqc/multiqc_report.html: a standalone HTML file that can be viewed in your web browser.multiqc_data/: directory containing parsed statistics from the different tools used in the pipeline.multiqc_plots/: directory containing static images from the report in various formats.
Pipeline information
Nextflow provides excellent functionality for generating various reports relevant to the running and execution of the pipeline. This will allow you to troubleshoot errors with the running of the pipeline, and also provide you with other information such as launch commands, run times and resource usage.
Output files
pipeline_info/- Reports generated by Nextflow:
execution_report.html,execution_timeline.html,execution_trace.txtandpipeline_dag.dot/pipeline_dag.svg. - Reports generated by the pipeline:
pipeline_report.html,pipeline_report.txtandsoftware_versions.yml. Thepipeline_report*files will only be present if the--email/--email_on_failparameter’s are used when running the pipeline. - Reformatted samplesheet files used as input to the pipeline:
samplesheet.valid.csv. - Parameters used by the pipeline run:
params.json.
- Reports generated by Nextflow: