nf-core/stableexpression
This pipeline is dedicated to identifying the most stable genes within a single or multiple expression dataset(s). This is particularly useful for identifying the most suitable RT-qPCR reference genes for a specific species.
Introduction
This document describes the output produced by the pipeline, relatively to the top-level results directory (defined by the --outdir parameter).
The directories listed below will be created in the results directory after the pipeline has finished.
Main output files
MultiQC
This report is located at reporting/multiqc_report.html and can be opened in a browser.
MultiQC is a visualization tool that generates a single HTML report summarising all samples in your project. The pipeline has special steps which also allow the software versions to be reported in the MultiQC output for future traceability. For more information about how to use MultiQC reports, see http://multiqc.info.
You can view the MultiQC report by opening multiqc_report.html in your browser.
Genes are divided into sections based on their mean normalised expression level. Genes in Section 1 are the most highly expressed genes while genes in last section are the least highly expressed. Users can modify the number of section (and hence the granularity of the analysis) by setting the --nb_sections parameter.
Be careful when setting the --nb_sections parameter. A value over 20 may result in a very large multiqc_report.html, which could be difficult to open in a browser.
Report content
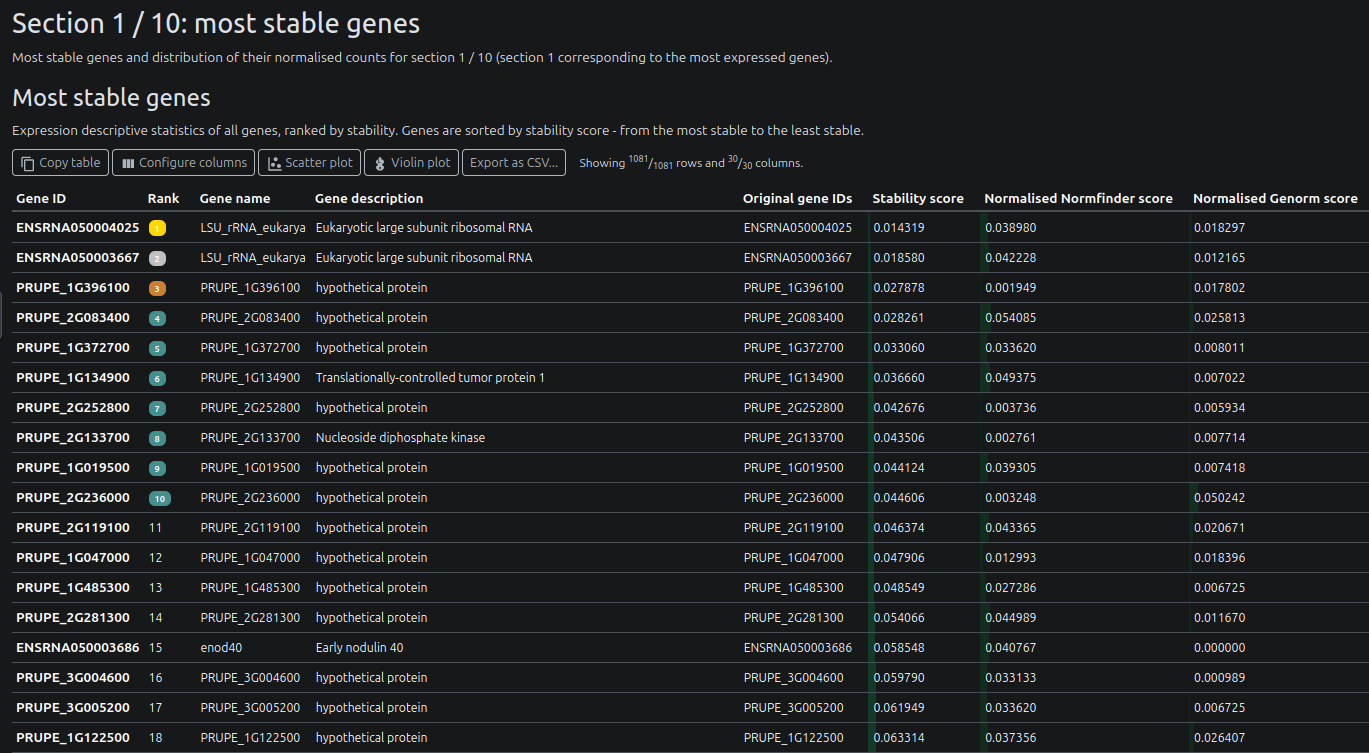
Gene tables
For each section of genes, a table is displayed with the gene names and their statistics (including their rank, stability score).
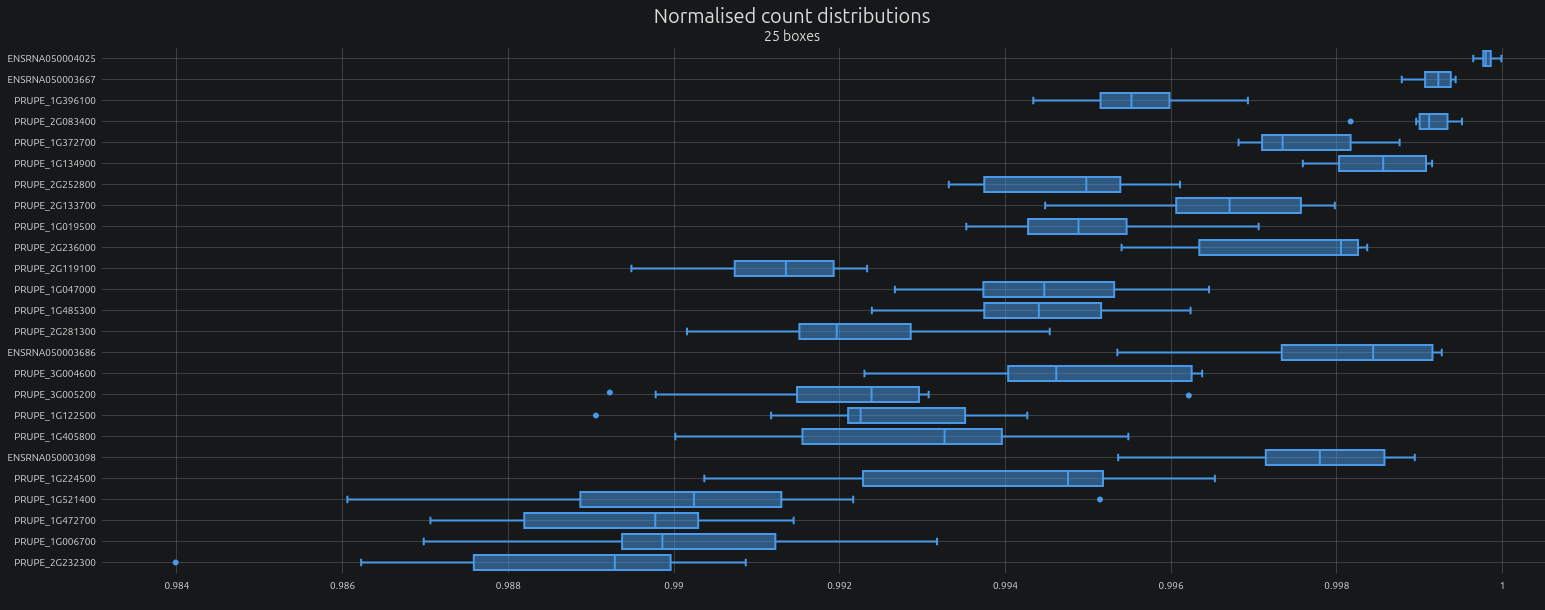
Gene normalised expression
For each section, the normalised expression values are displayed of the top 25 genes are displayed as boxplots.
Dataset statistics
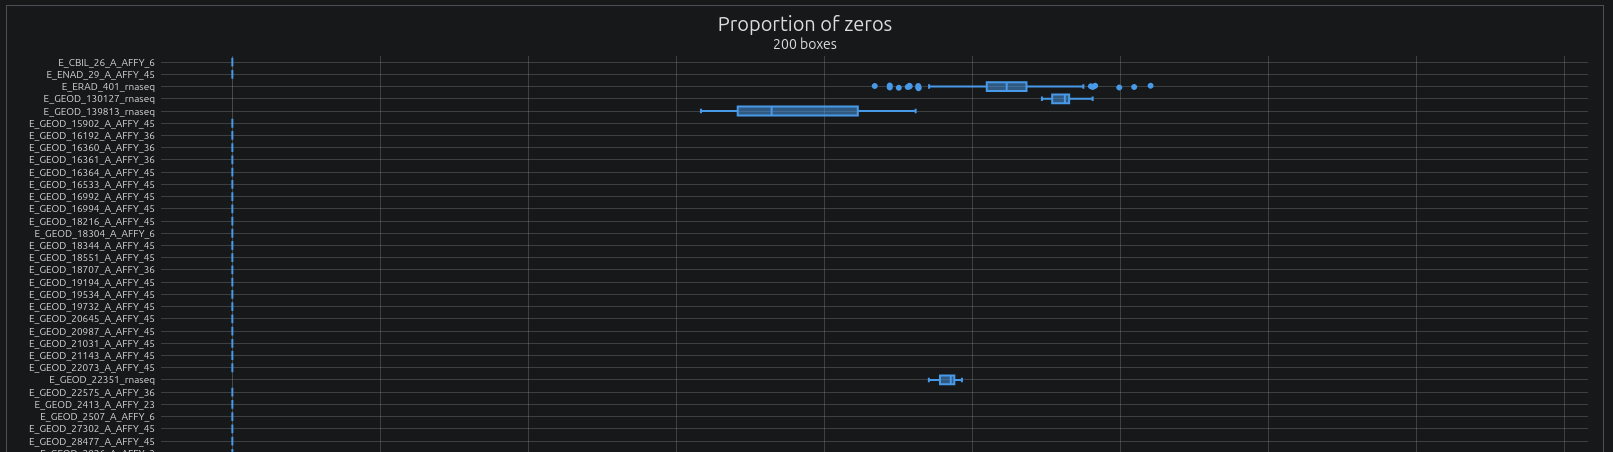
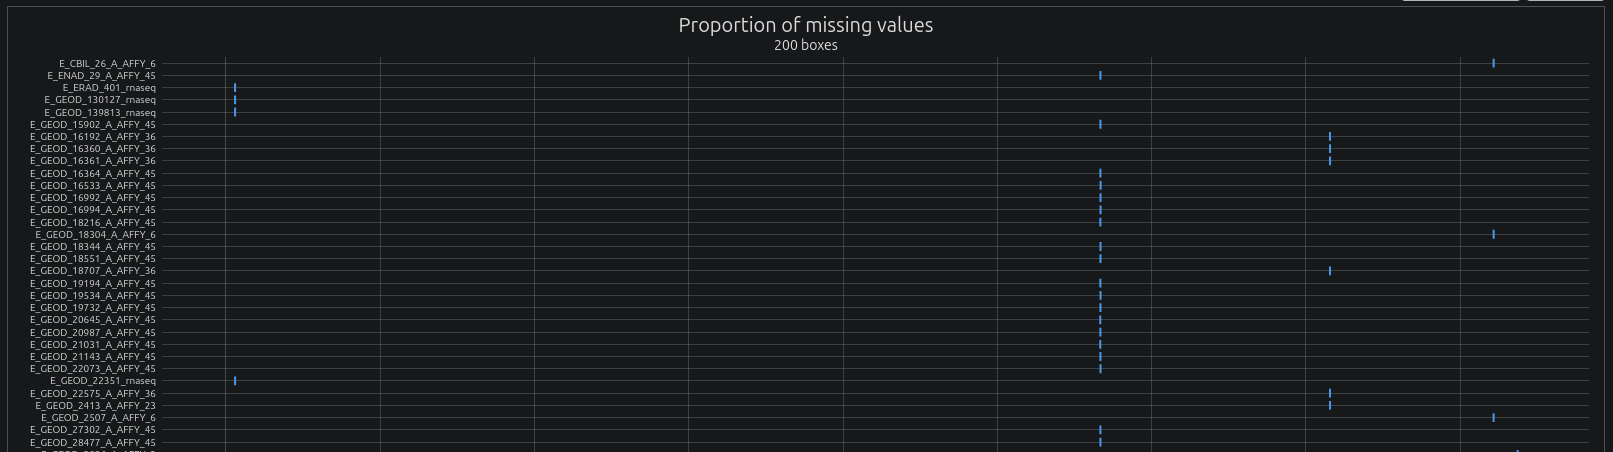
Various statistics about the analysed datasets are displayed, including the number of genes, the mean and standard deviation of the normalised expression values.
Skewness of normalised expression values:

Proportion of zero values:
Proportion of missing values (genes not present but present in other samples):
Dataset filtering
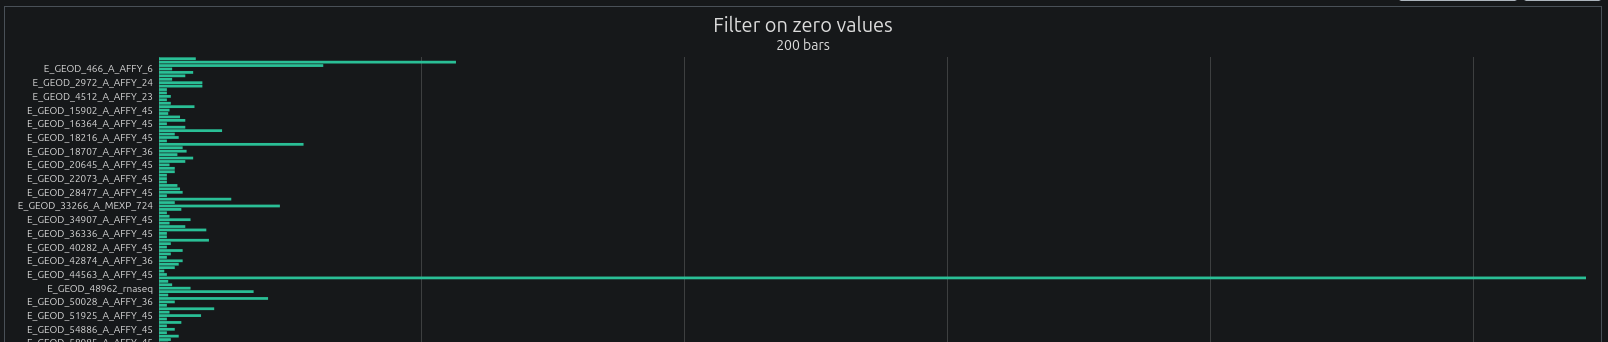
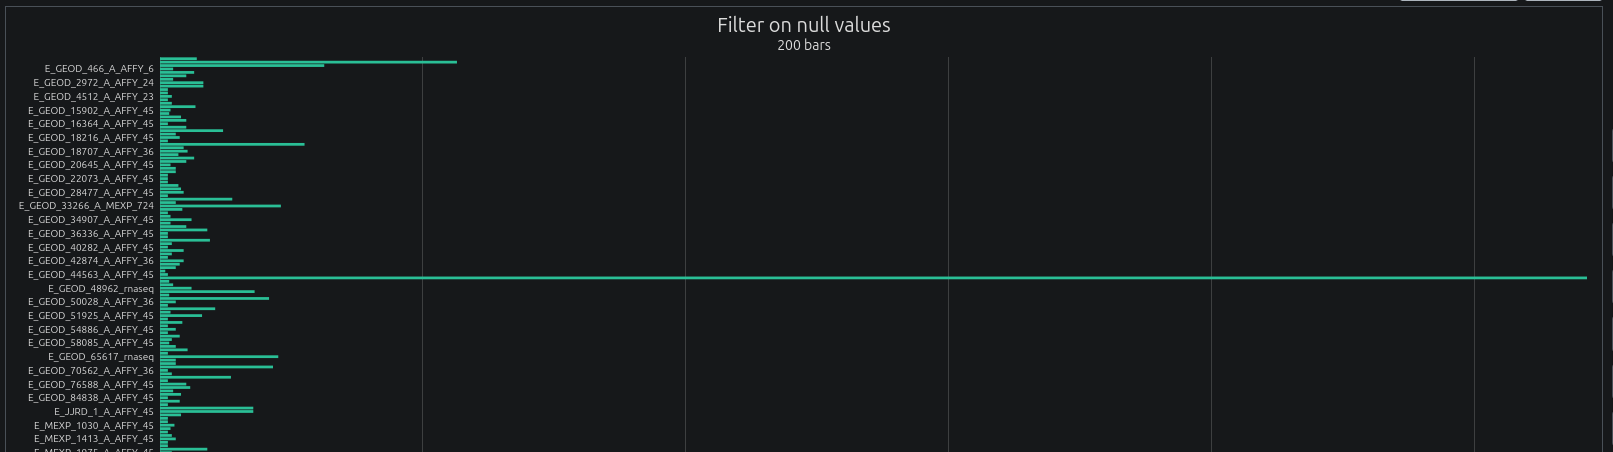
For each dataset, samples displaying a too high proportion of zero values or missing values are filtered out. The filtered datasets are then used for further analysis. The report displays the proportion of samples filtered out for each dataset. Users can modify the filtering thresholds using the --max_zero_ratio and --max_null_ratio parameters respectively.
Proportions of samples filtered out based on zero values:
Proportions of samples filtered out based on missing values:
Gene ID mapping
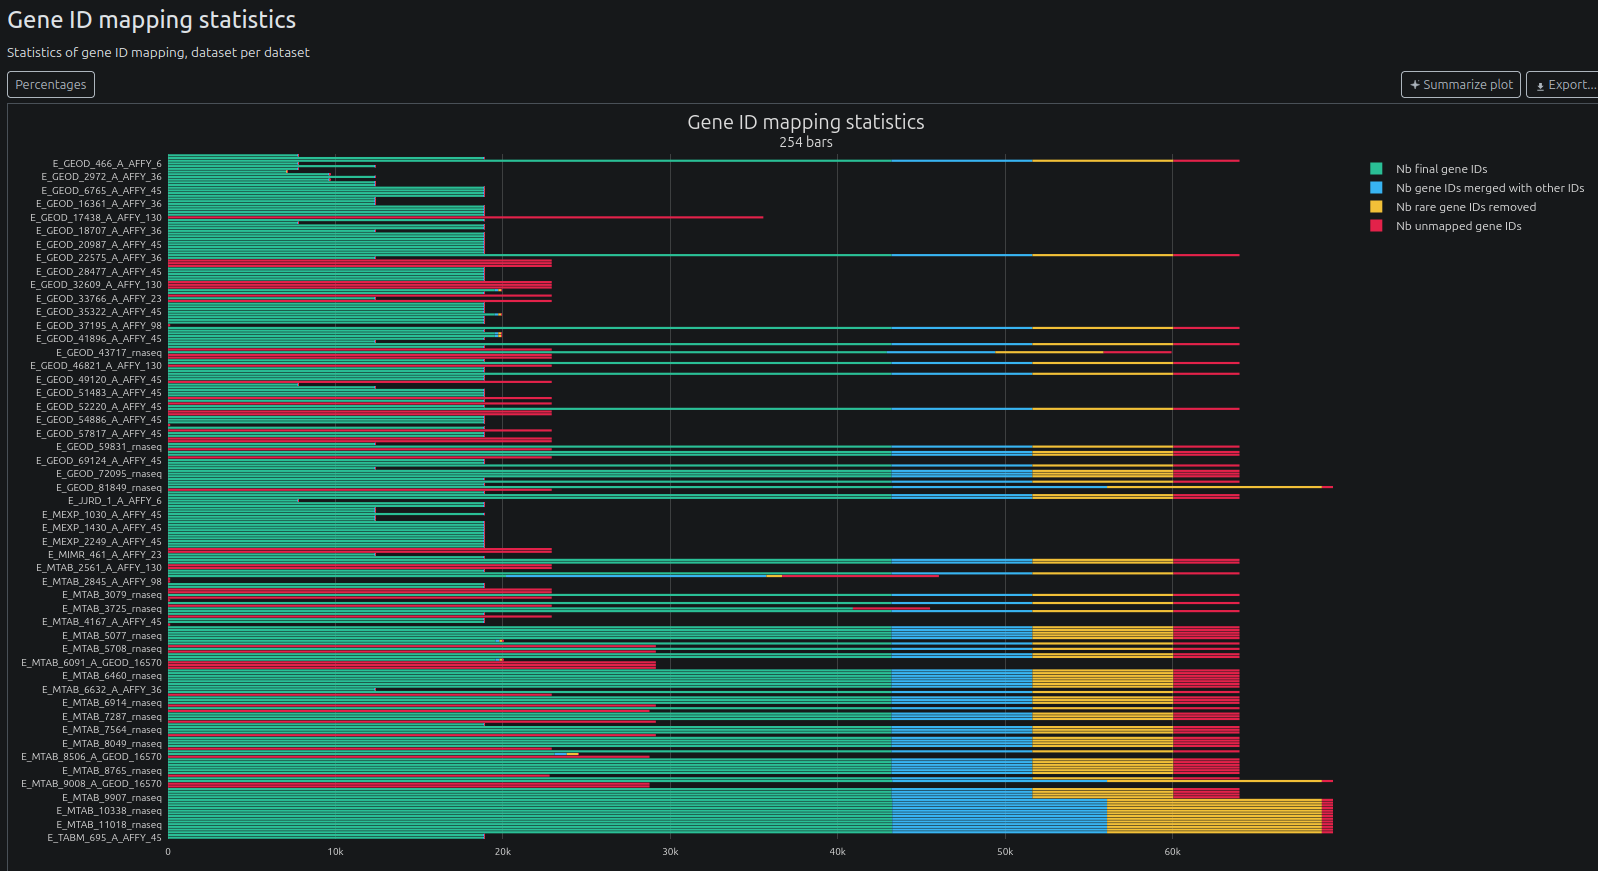
The pipeline maps gene IDs to their corresponding gene names using the Ensembl database.
Distribution of gene occurrences:
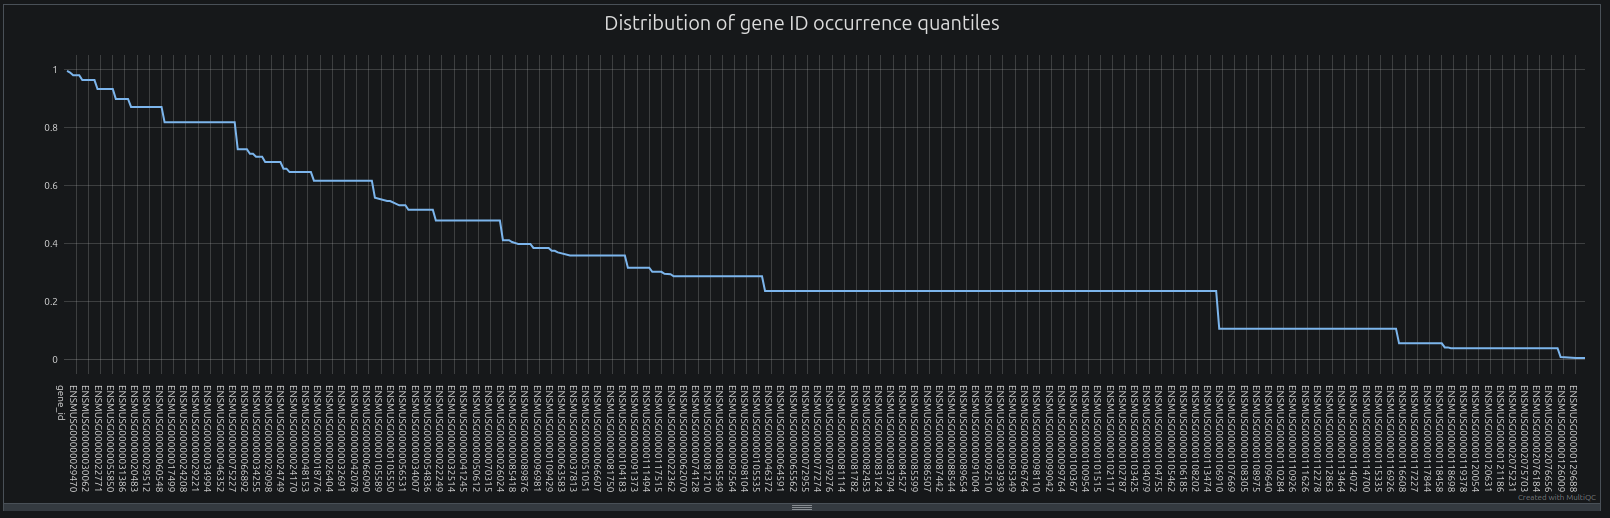
NB: The pipeline filters out genes based on gene ID occurrence using two parameters: --min_occurrence_freq and --min_occurrence_quantile. The first parameter filters out genes showing a too low frequency of occurrence, while the second parameter filters genes belonging to the last quantiles of occurrence. Users can tweak these parameters to increase or decrease the filtering stringency. The distribution of gene occurrences displayed in the MultiqcQC report can be very useful to detect a plateau of gene ID occurrence frequency, which can indicate the presence of rare gene IDs. In the distribution above, a plateau is reached around 0.236. In such case, setting --min_occurrence_freq 0.24 (default: 0.2) will remove all gene IDs with an occurrence frequency below this plateau.
Gene ID mapping statistics:
Reasons of failures of gene ID mapping:

Reasons of incomplete gene ID mapping:

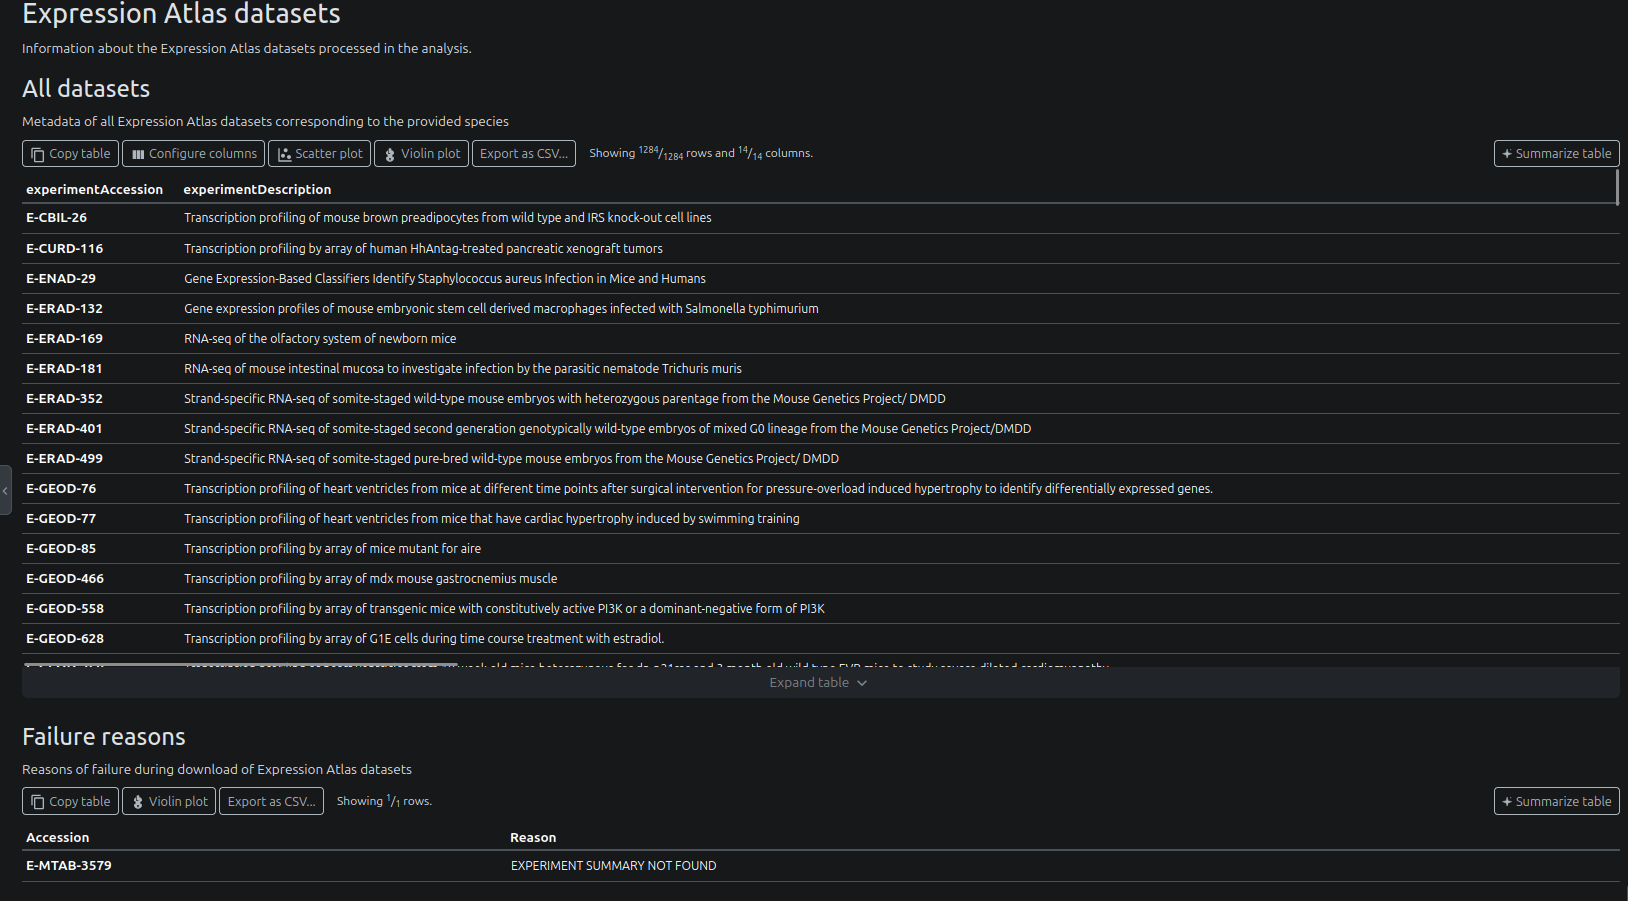
Downloaded datasets
The report shows metadata about the downloaded datasets:
- Expression Atlas
- optionally: GEO datasets (when
--fetch_geo_accessionswas set)
The report also has a section for datasets that could not be downloaded, and the reasons for failure.
Example for Expression Atlas:
Software version
You can access versions of all softwares used in the pipeline, step by step:

Dash Plotly app
reporting/dash_app/: folder containing the Dash Plotly app.
Dash Plotly is a web-based interactive visualization library that allows you to create interactive plots and dashboards.
Launch application
To launch the app, you must first create and activate the appropriate conda environment:
conda env create -n dash_app -f reporting/dash_app/environment.ymlconda activate dash_appthen:
cd reporting/dash_apppython app.pyand open your browser at http://localhost:8080
The app will try to use the port 8080 by default. If it is already in use, it will try 8081, 8082 and so on. Check the logs to see which port it is using.
Use the app
Overview
The application contains 3 tabs:
- a first tab showing the distribution of expressions for selected genes, accross of all samples that passed filtering
- a second tab showing the distribution of all gene expressions in selected samples (only for samples that passed filtering)
- a third tab showing scoring / statistics for all genes
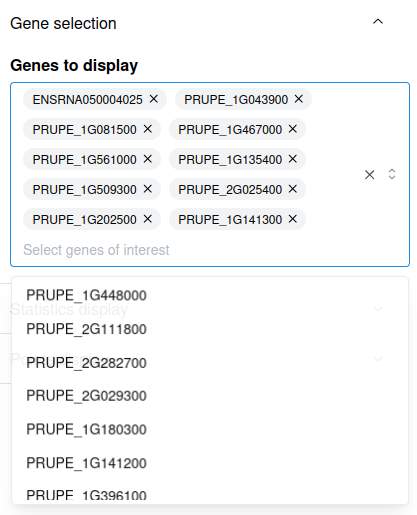
The header allows navigating between the tabs. Click on a specific tab to switch to it. The Select data / options button allows selecting the dataset to display, together with other options.

Distribution of gene expressions (Counts / gene)
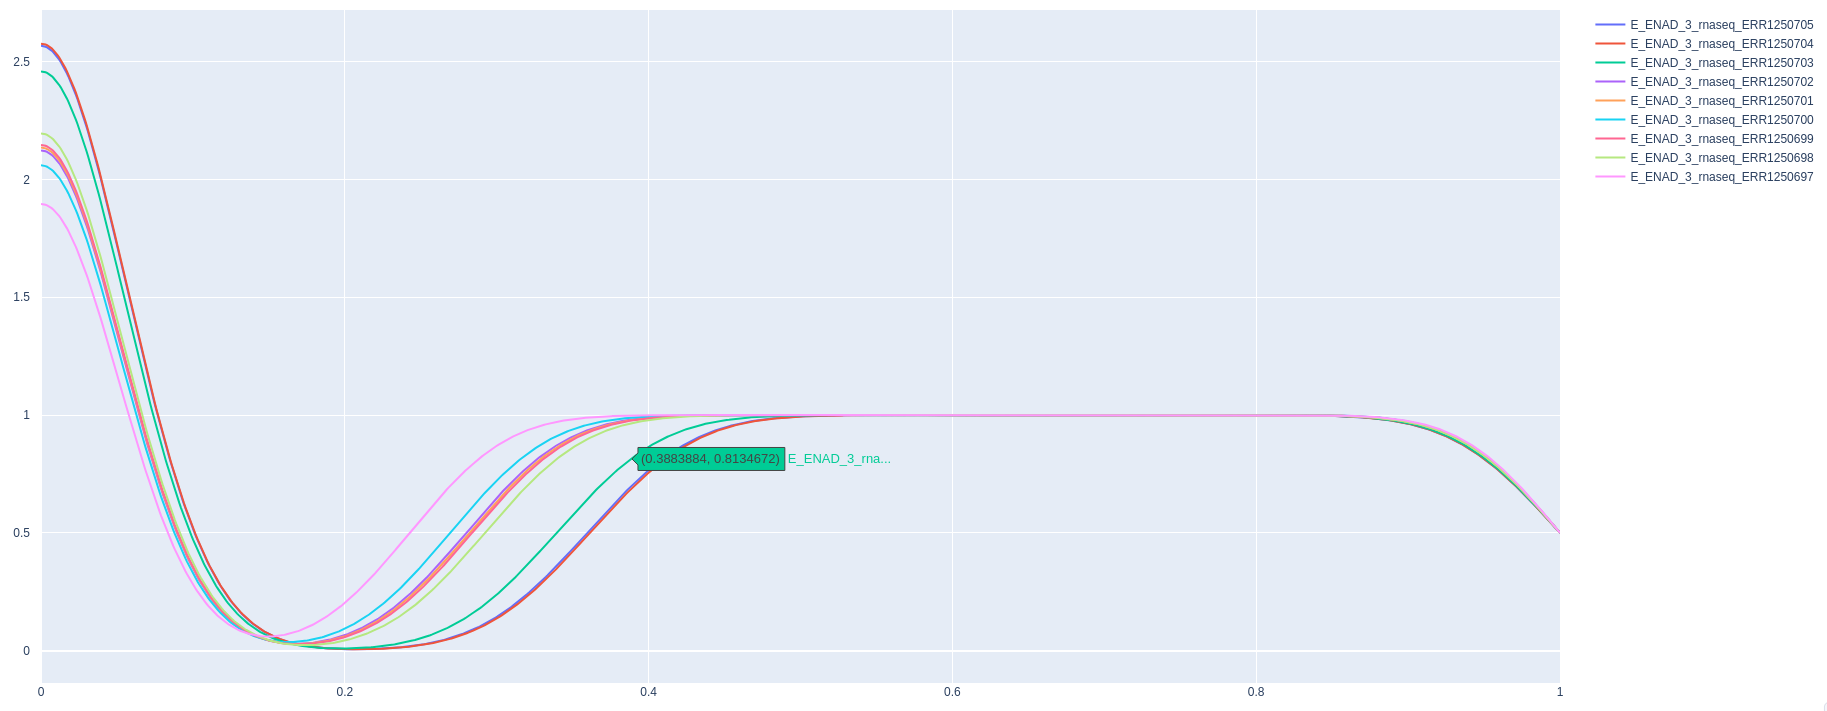
Users can visualise the distribution of expressions of specific genes.
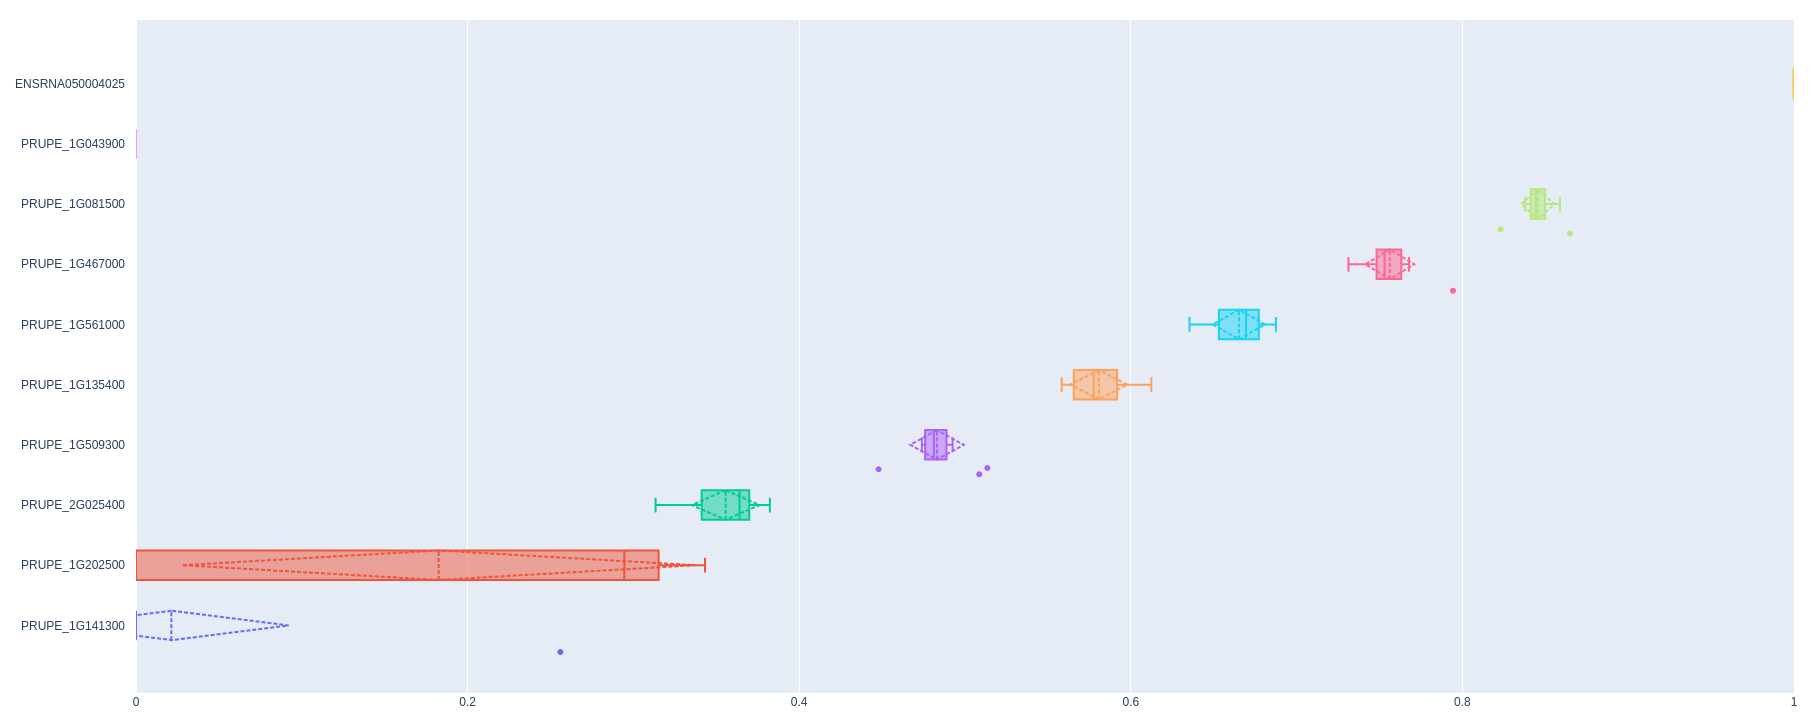
To select a gene, just start typing its name and click on it when it appears.
Distribution of all gene expressions in specific samples (Counts / sample)
You can visualise the distribution of expressions of all genes in specific samples. Likewise, to select a sample, you may type its name and click on it when it appears.
Gene scoring / statistics (Statistics - all genes)
Scores and statistics for each gene are displayed here.
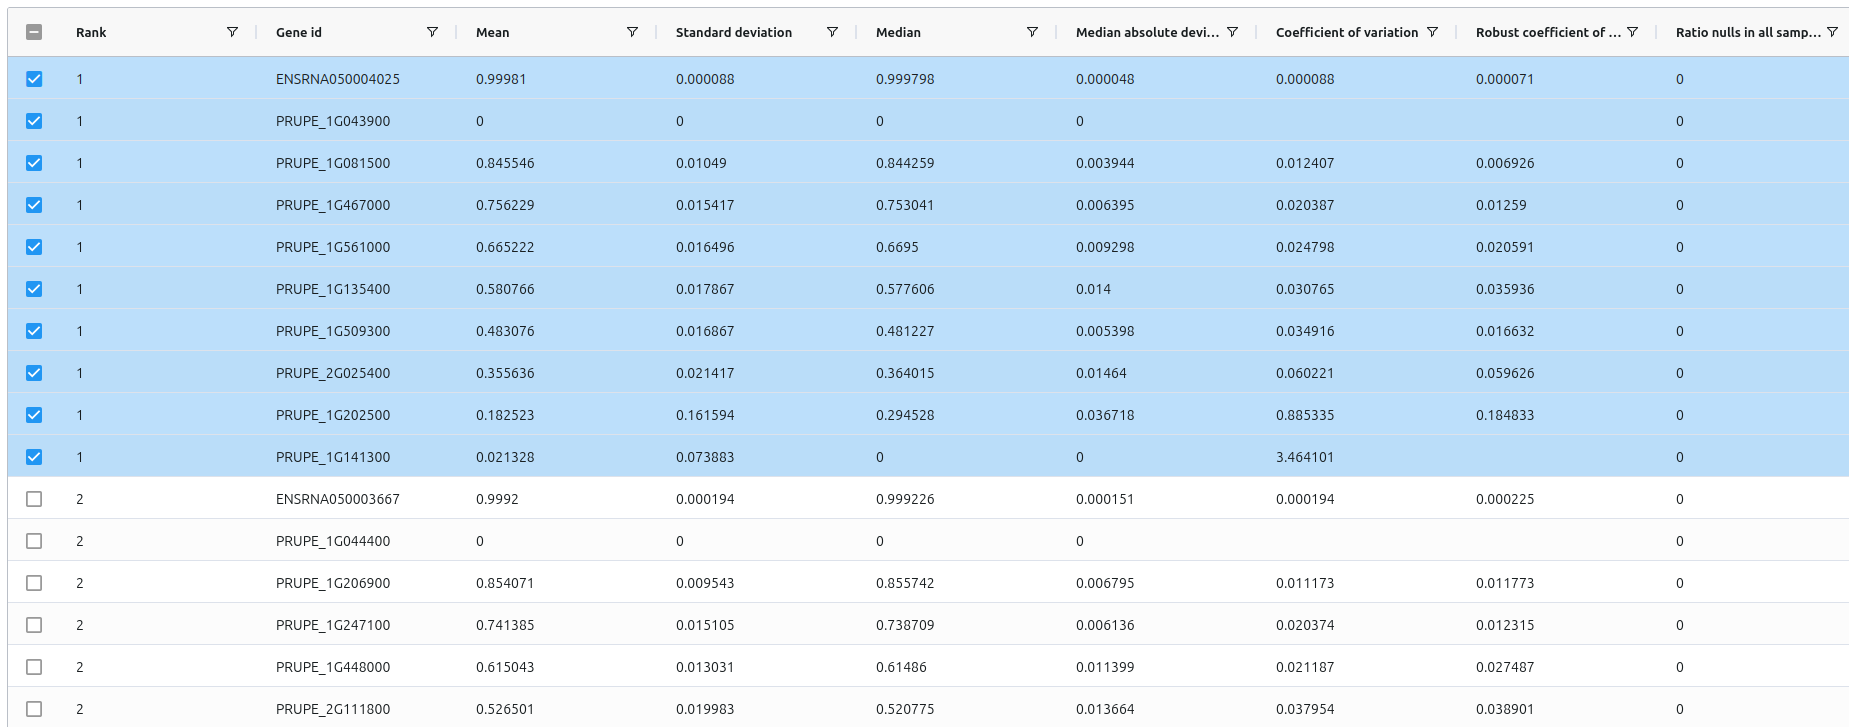
NB: Users can select a gene directly in the table by ticking the checkbox next to the gene name. This will add the gene to the list of selected genes in the Counts / gene tab.
Gene statistics and scores
The pipelines also exports a summary of all genes, located at reporting/all_genes_summary.csv. It contains their statistics, scores, ranks and respective sections.
Merged data
Parquet files containing all normalised gene counts are also stored in the merged_data/ directory.
Merged data
merged_data/all_counts.imputed.parquet: parquet file containing all normalised + imputed gene countsmerged_data/all_counts.parquet: parquet file containing all normalised gene countsmerged_data/whole_design.csv: table containing designs for all datasets and all samples comprised in the analysis
Other output files of interest (useful for debbuging)
Individual datasets
All individual datasets are also stored at each step of the pipelines, with the following pattern:
datasets/<platform>/<normalisation status>/<dataset name>/
Sub sections
0.downloaded/: raw datasets downloaded from public databases1.id_filtered_renamed/: datasets with filtered and renamed gene IDs2.samples_filtered/: datasets with filtered samples3.:TPM/CPMnormalisation3.tpm_normalised/:TPMnormalised datasets3.cpm_normalised/:CPMnormalised datasets
4.quantile_normalised/: quantile normalised datasets
The design of each dataset is also stored in its own directory.
Expression Atlas / GEO accessions
Accession files
accessions/expression_atlas/: accessions found when querying Expression Atlasaccessions/geo/: accessions found when querying GEO
ID Mapping
The pipeline also exports the ID mapping metadata used for gene ID conversion.
ID mapping metadata
idmapping/global_gene_metadata.csv: table containing the complete set of gene metadata, obtained either via gProfiler or via the custom file provided by the useridmapping/global_gene_id_mapping.csv: table containing the complete set of gene id mapping, obtained either via gProfiler or via the custom fileidmapping/valid_gene_ids.txt: List of gene IDs retained as valid
Annotation / gene length
The annotation and gene lengths are also stored in the annotation/ directory.
Files
gene_transcript_lengths.csv: transcript length relative to each gene ID<annotation name>.gff3.gz: GFF3 file
Pipeline information
Output files
pipeline_info/- Reports generated by Nextflow:
execution_report.html,execution_timeline.html,execution_trace.txtandpipeline_dag.dot/pipeline_dag.svg. - Reports generated by the pipeline:
pipeline_report.html,pipeline_report.txtandsoftware_versions.yml. Thepipeline_report*files will only be present if the--email/--email_on_failparameter’s are used when running the pipeline. - Parameters used by the pipeline run:
params.json.
- Reports generated by Nextflow:
Nextflow provides excellent functionality for generating various reports relevant to the running and execution of the pipeline. This will allow you to troubleshoot errors with the running of the pipeline, and also provide you with other information such as launch commands, run times and resource usage.